Market Stability
Guide · 2 min read
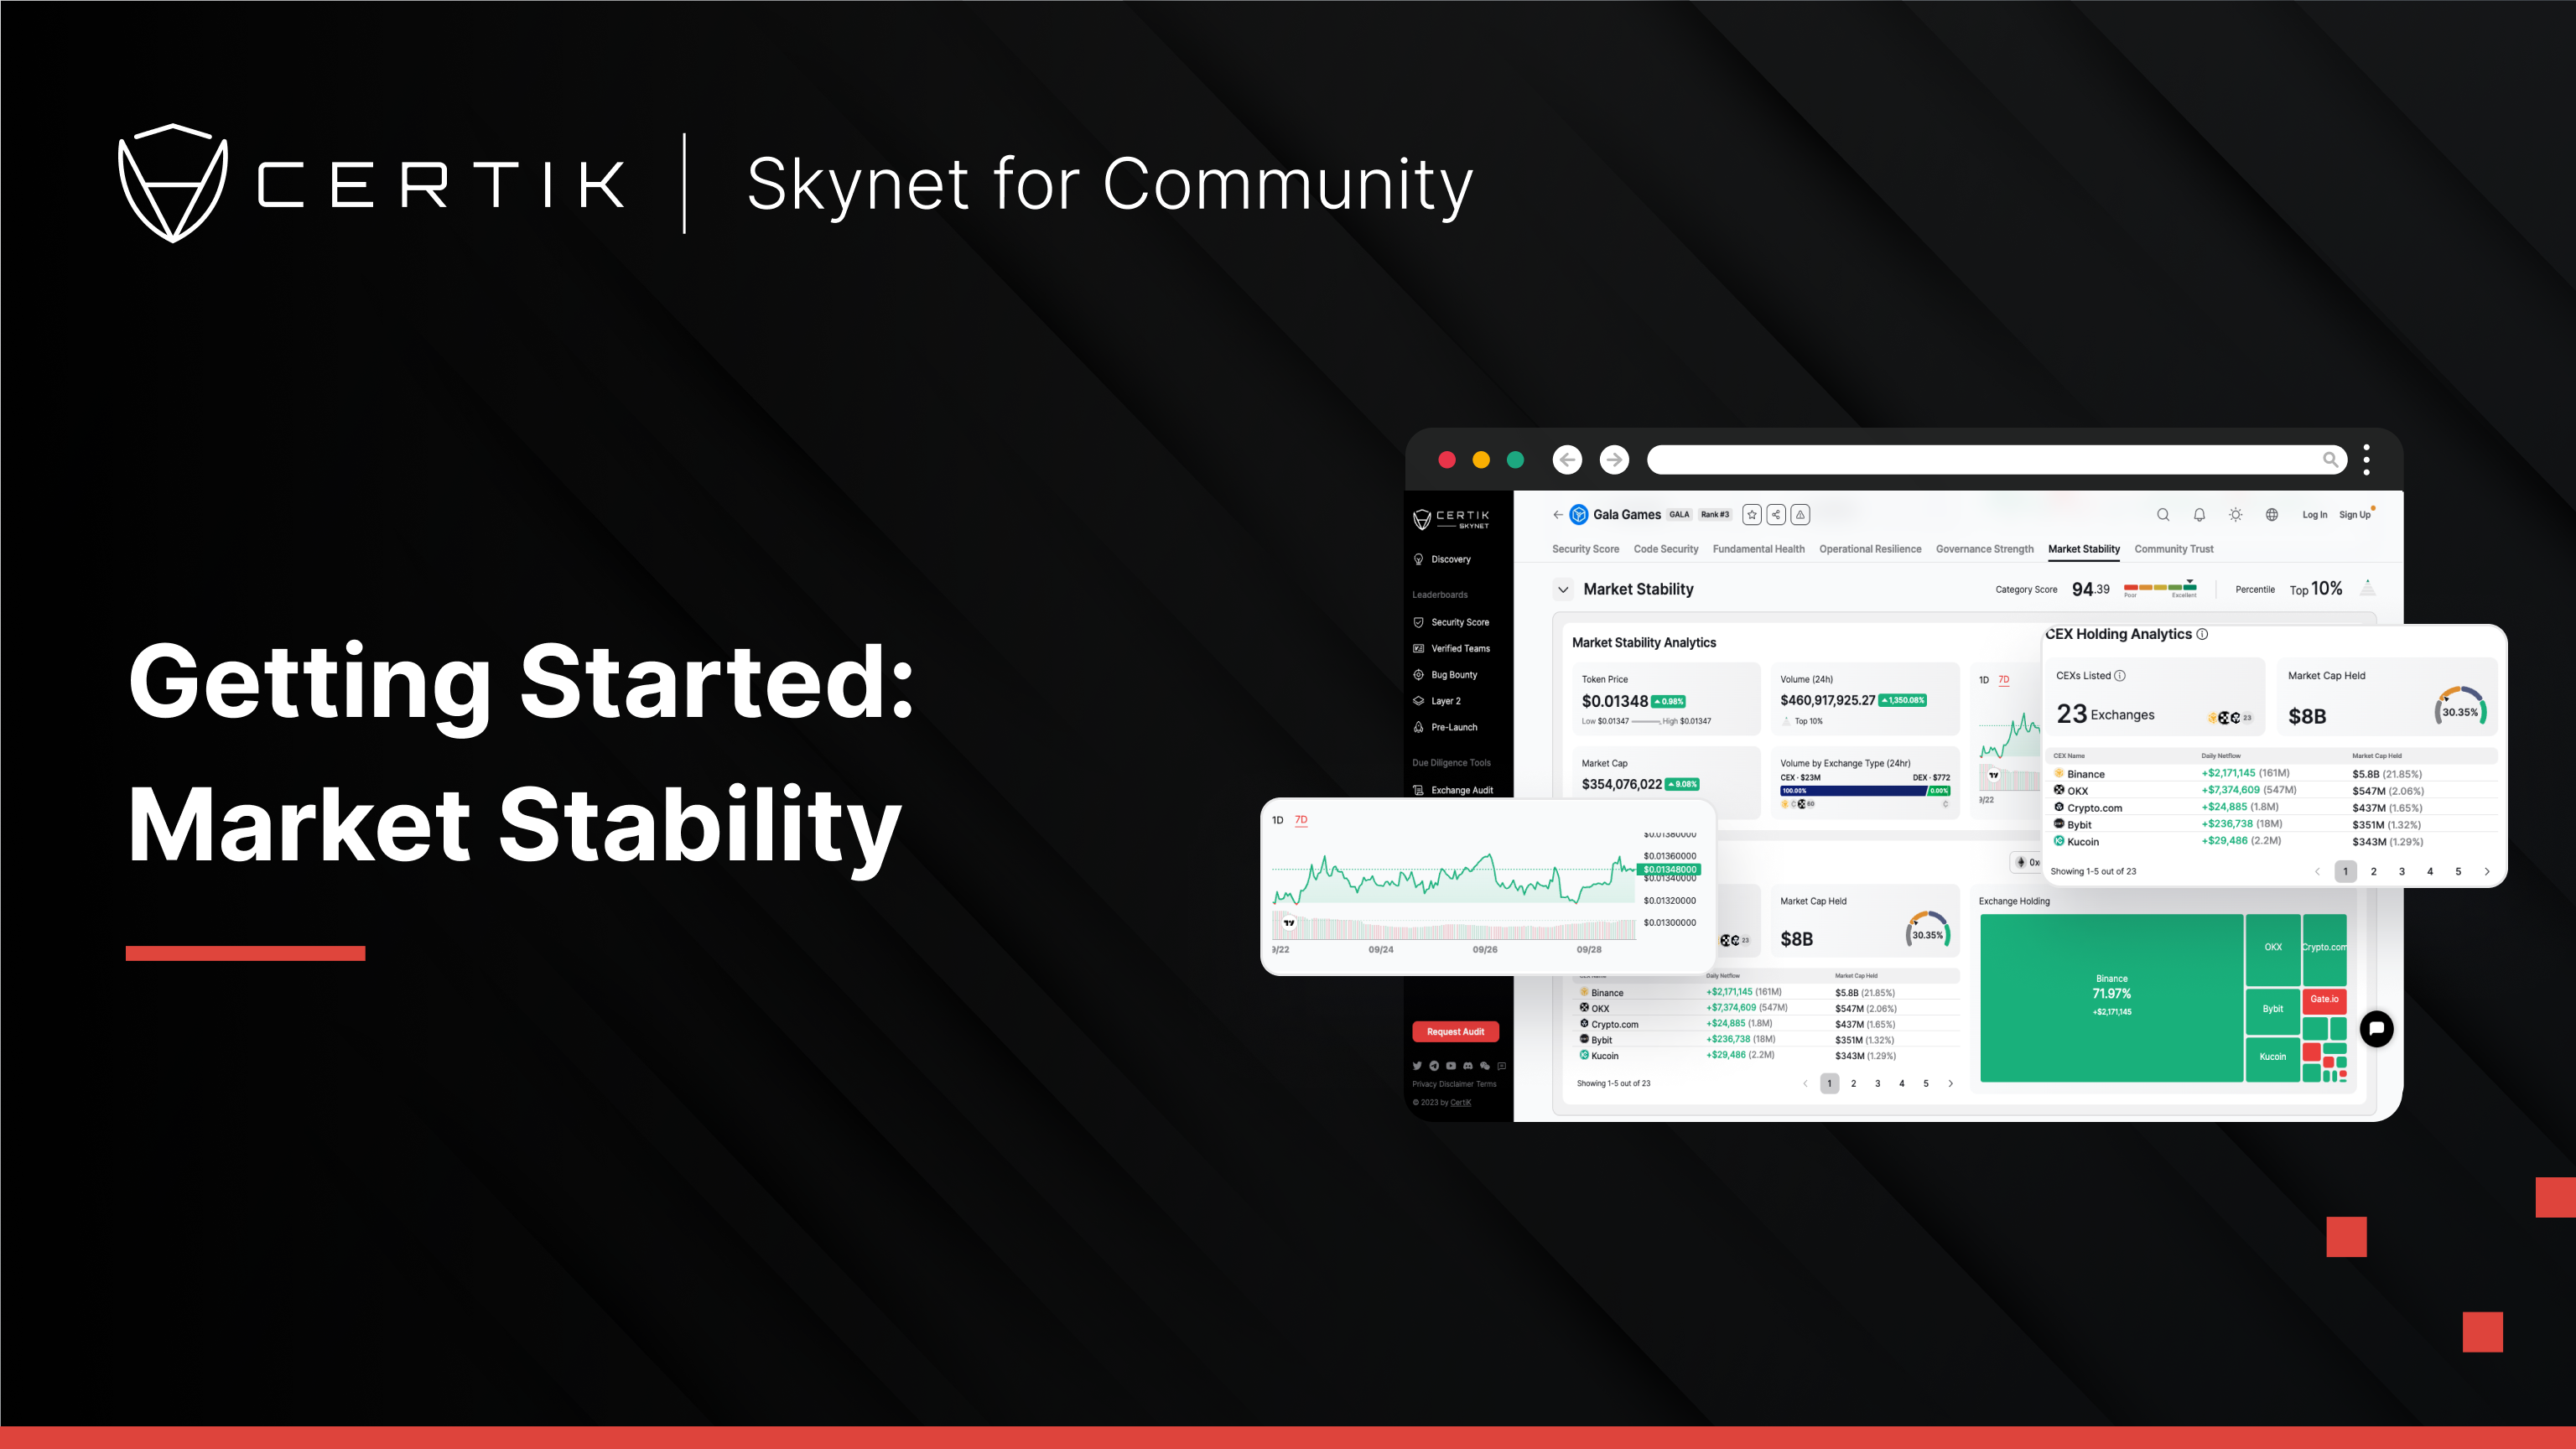
The Market Stability Analytics section offers a concise summary of vital market metrics related to a project's token. These metrics include the token's current price, trading volume over the past 24 hours, market capitalization, and a breakdown of trading volume by exchange type within the same 24-hour period. This breakdown provides insight into the primary types of exchanges where the token is most actively traded. To the right of the section is a graph that visually illustrates the token’s price movements over the previous seven days.

From a security perspective, knowing the market performance of a token is vital as it allows users to assess the token's stability, trading activity, and potential vulnerabilities. This information is essential for safeguarding investments and identifying any unusual or risky behavior that may pose security threats or expose vulnerabilities in the token's ecosystem.
The CEX (Centralized Exchange) Holding Analytics section provides an examination of the centralized exchanges where the project's token is actively traded. This section displays the number of centralized exchanges that list the token and the total market capitalization collectively held by these exchanges.

To the right, you will find a visualization of CEX holdings that reveals which exchanges dominate in terms of holding the project's token.
It is important to note that we do not necessarily list all the exchanges where the token is traded, but rather focus on those within our monitoring scope, which is sourced from Coinmarketcap. While this data offers insights into the token's presence on most major and well-known exchanges, it may not encompass every exchange.
Understanding CEX holding analytics from a security perspective is crucial as it allows individuals to assess the token's exposure to centralized exchanges, helping them gauge potential vulnerabilities or risks associated with these platforms.
Token Correlation indicates the degree to which the price movements of the targeted project align with those of similar assets. A positive correlation signifies that the two assets generally move in tandem, whereas a negative correlation indicates that they typically move in opposite directions.

Guide · 5 min read
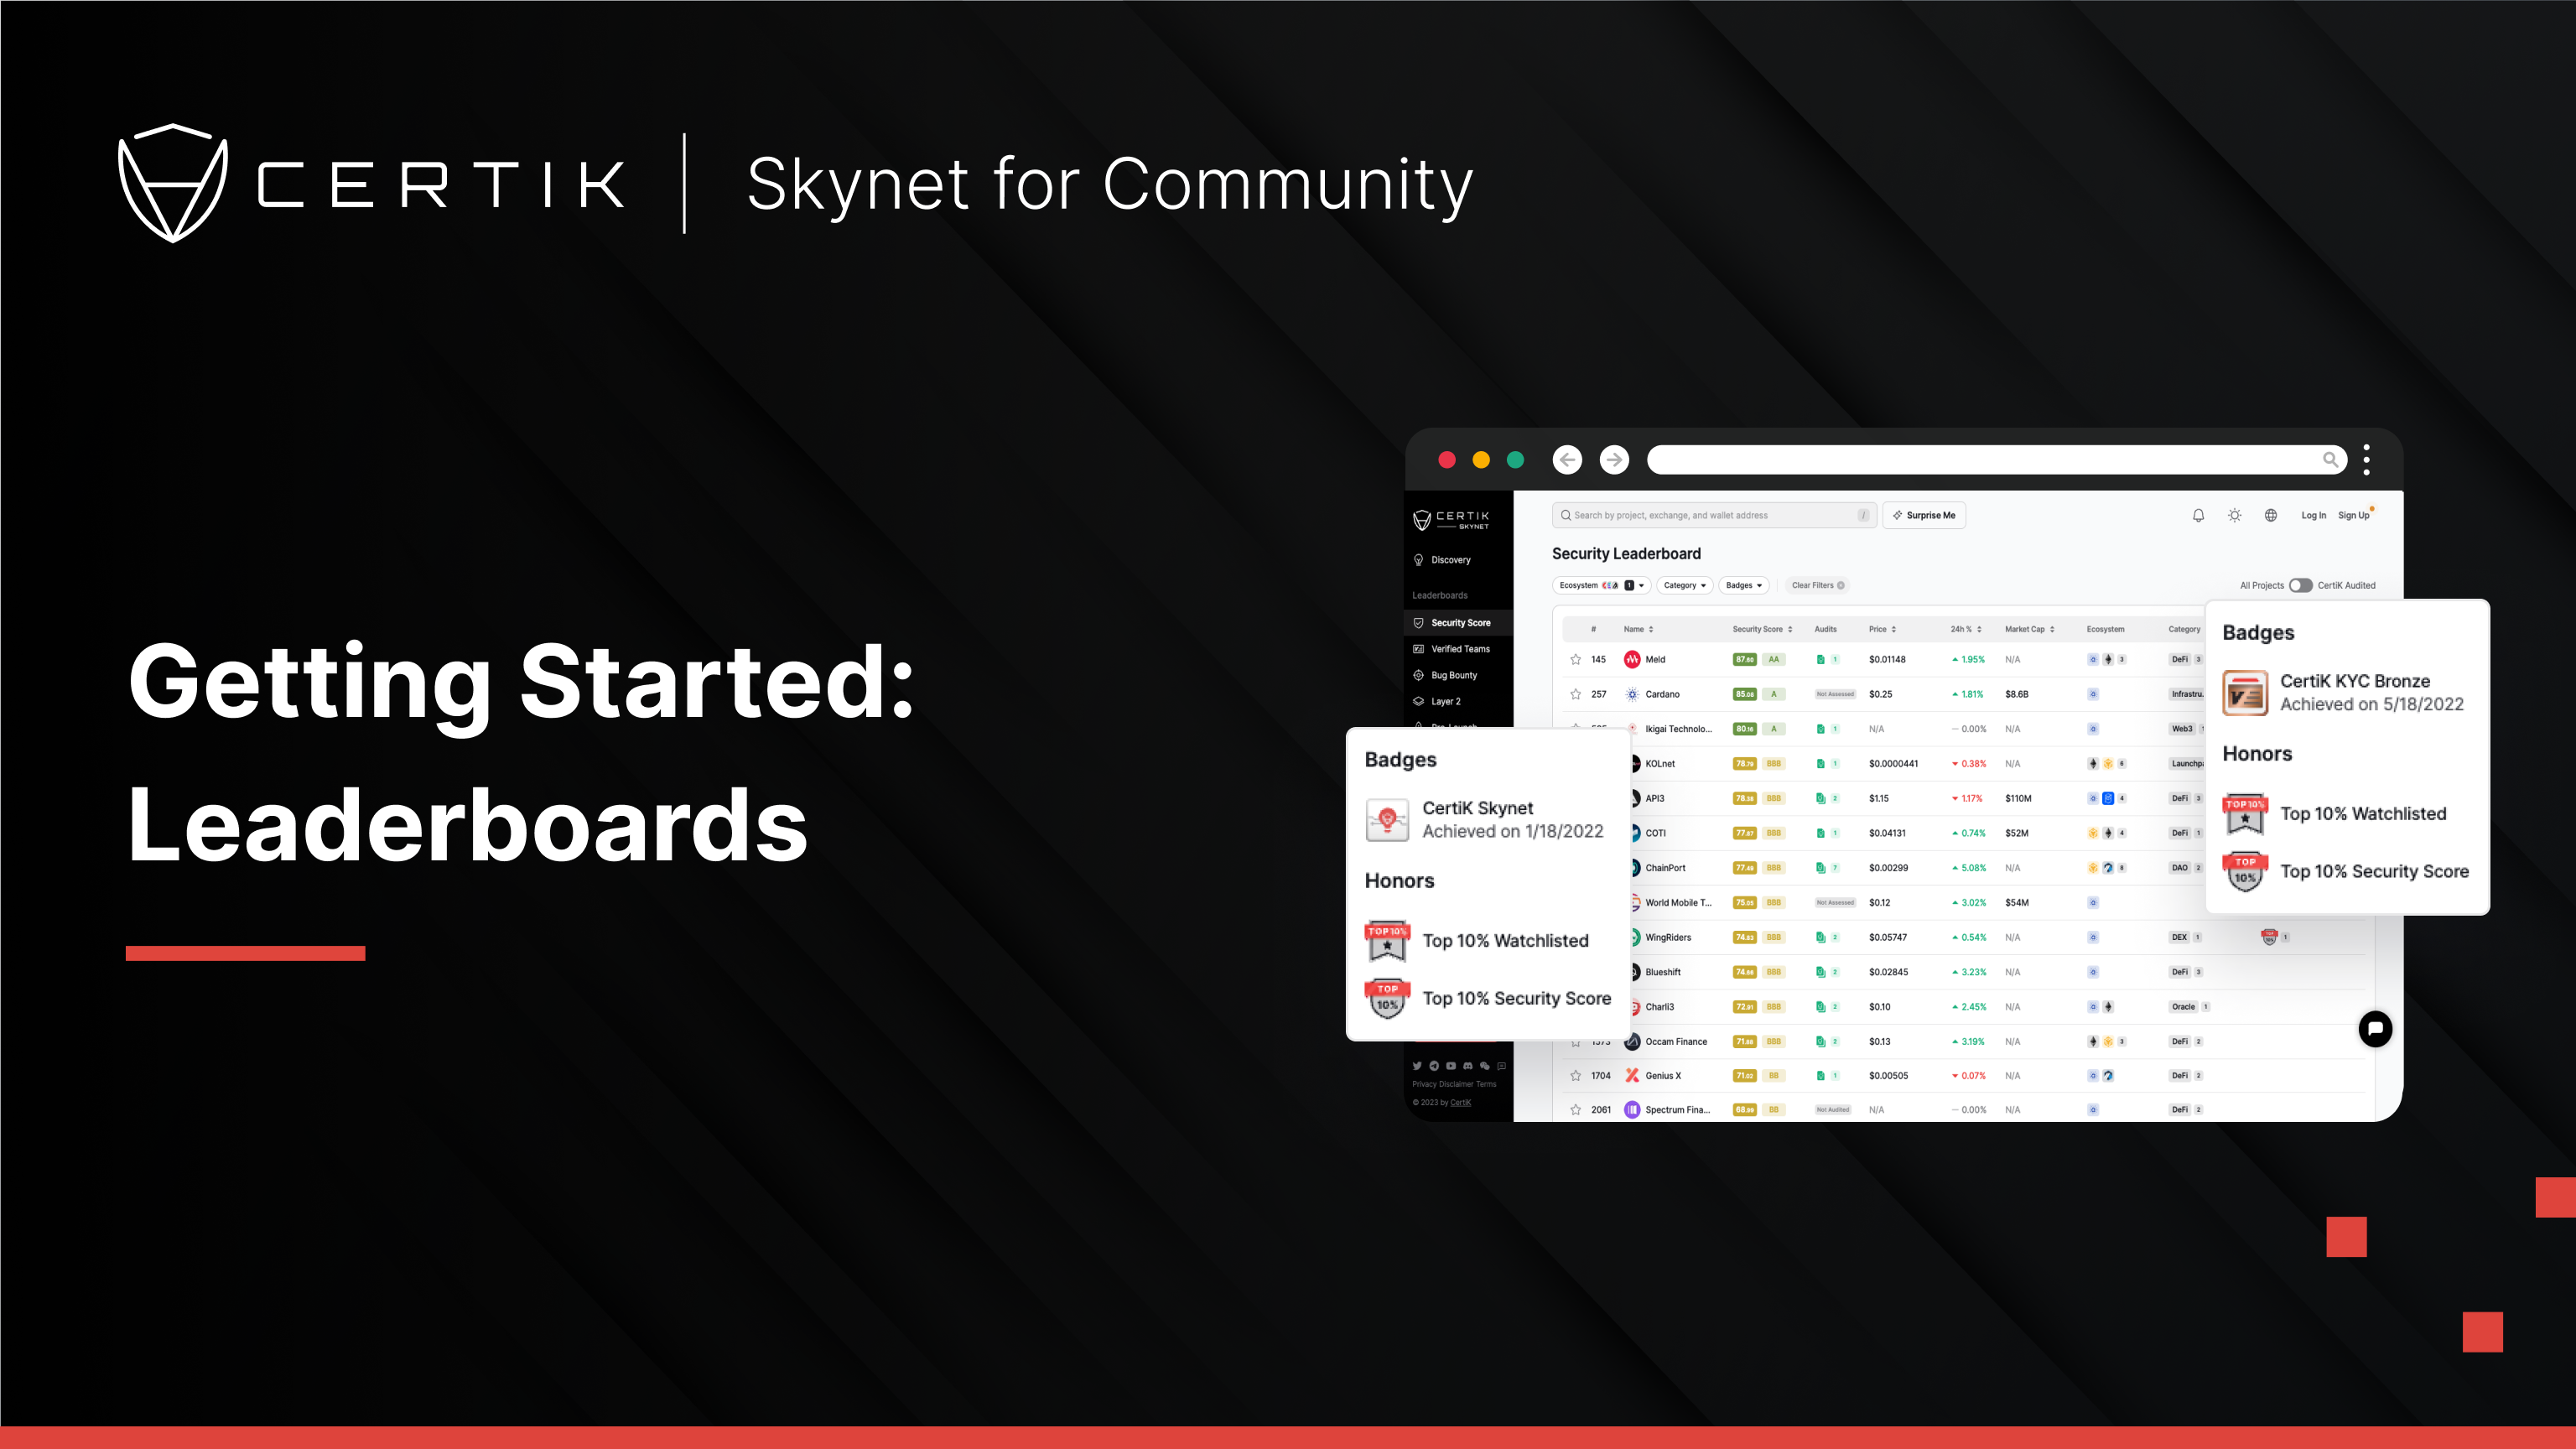
Leaderboards
Skynet Leaderboards: Discover rankings for security, verified teams, bug bounties, Layer 2, and pre-launch projects.

Guide · 4 min read
Diligence Insights
The Diligence Insights module helps you evaluate important on-chain metrics, exchange pair dynamics, activity on exchanges, and token holder data.
Guide · 2 min read
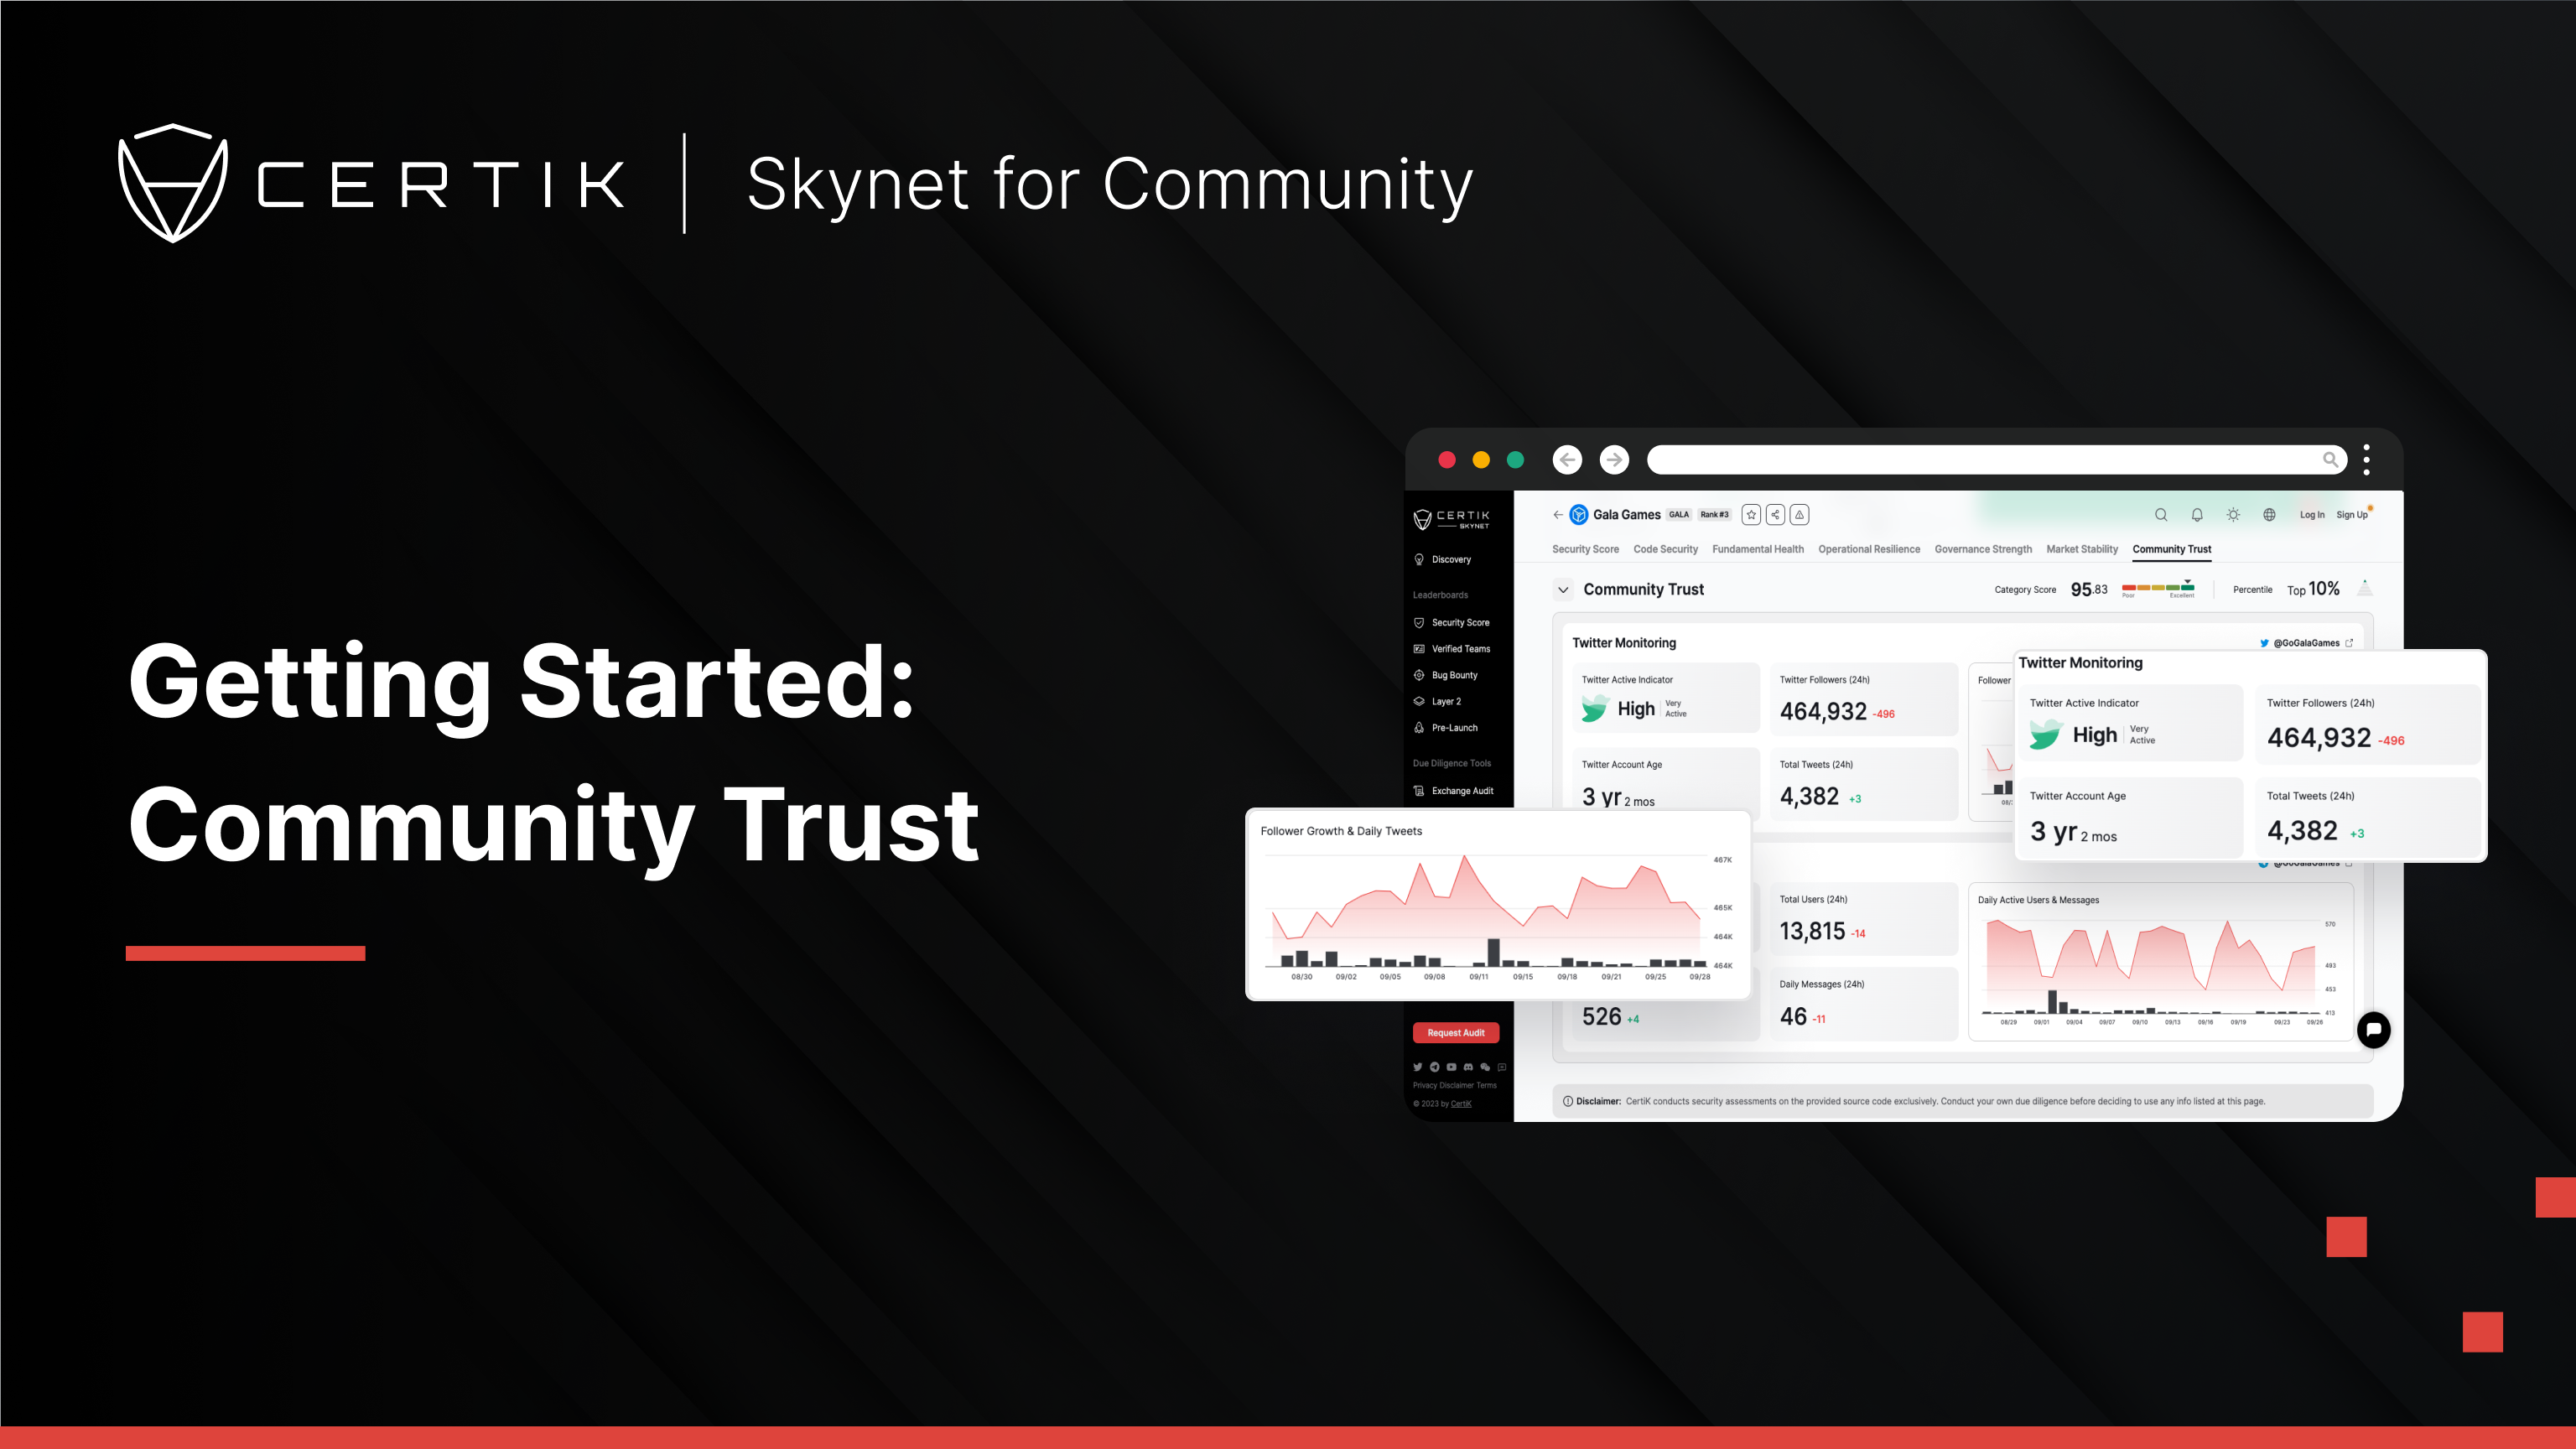
Community Trust
The Community Trust module assesses social engagement & sentiment on platforms like Twitter, Telegram, and Discord.
Guide · 7 min read
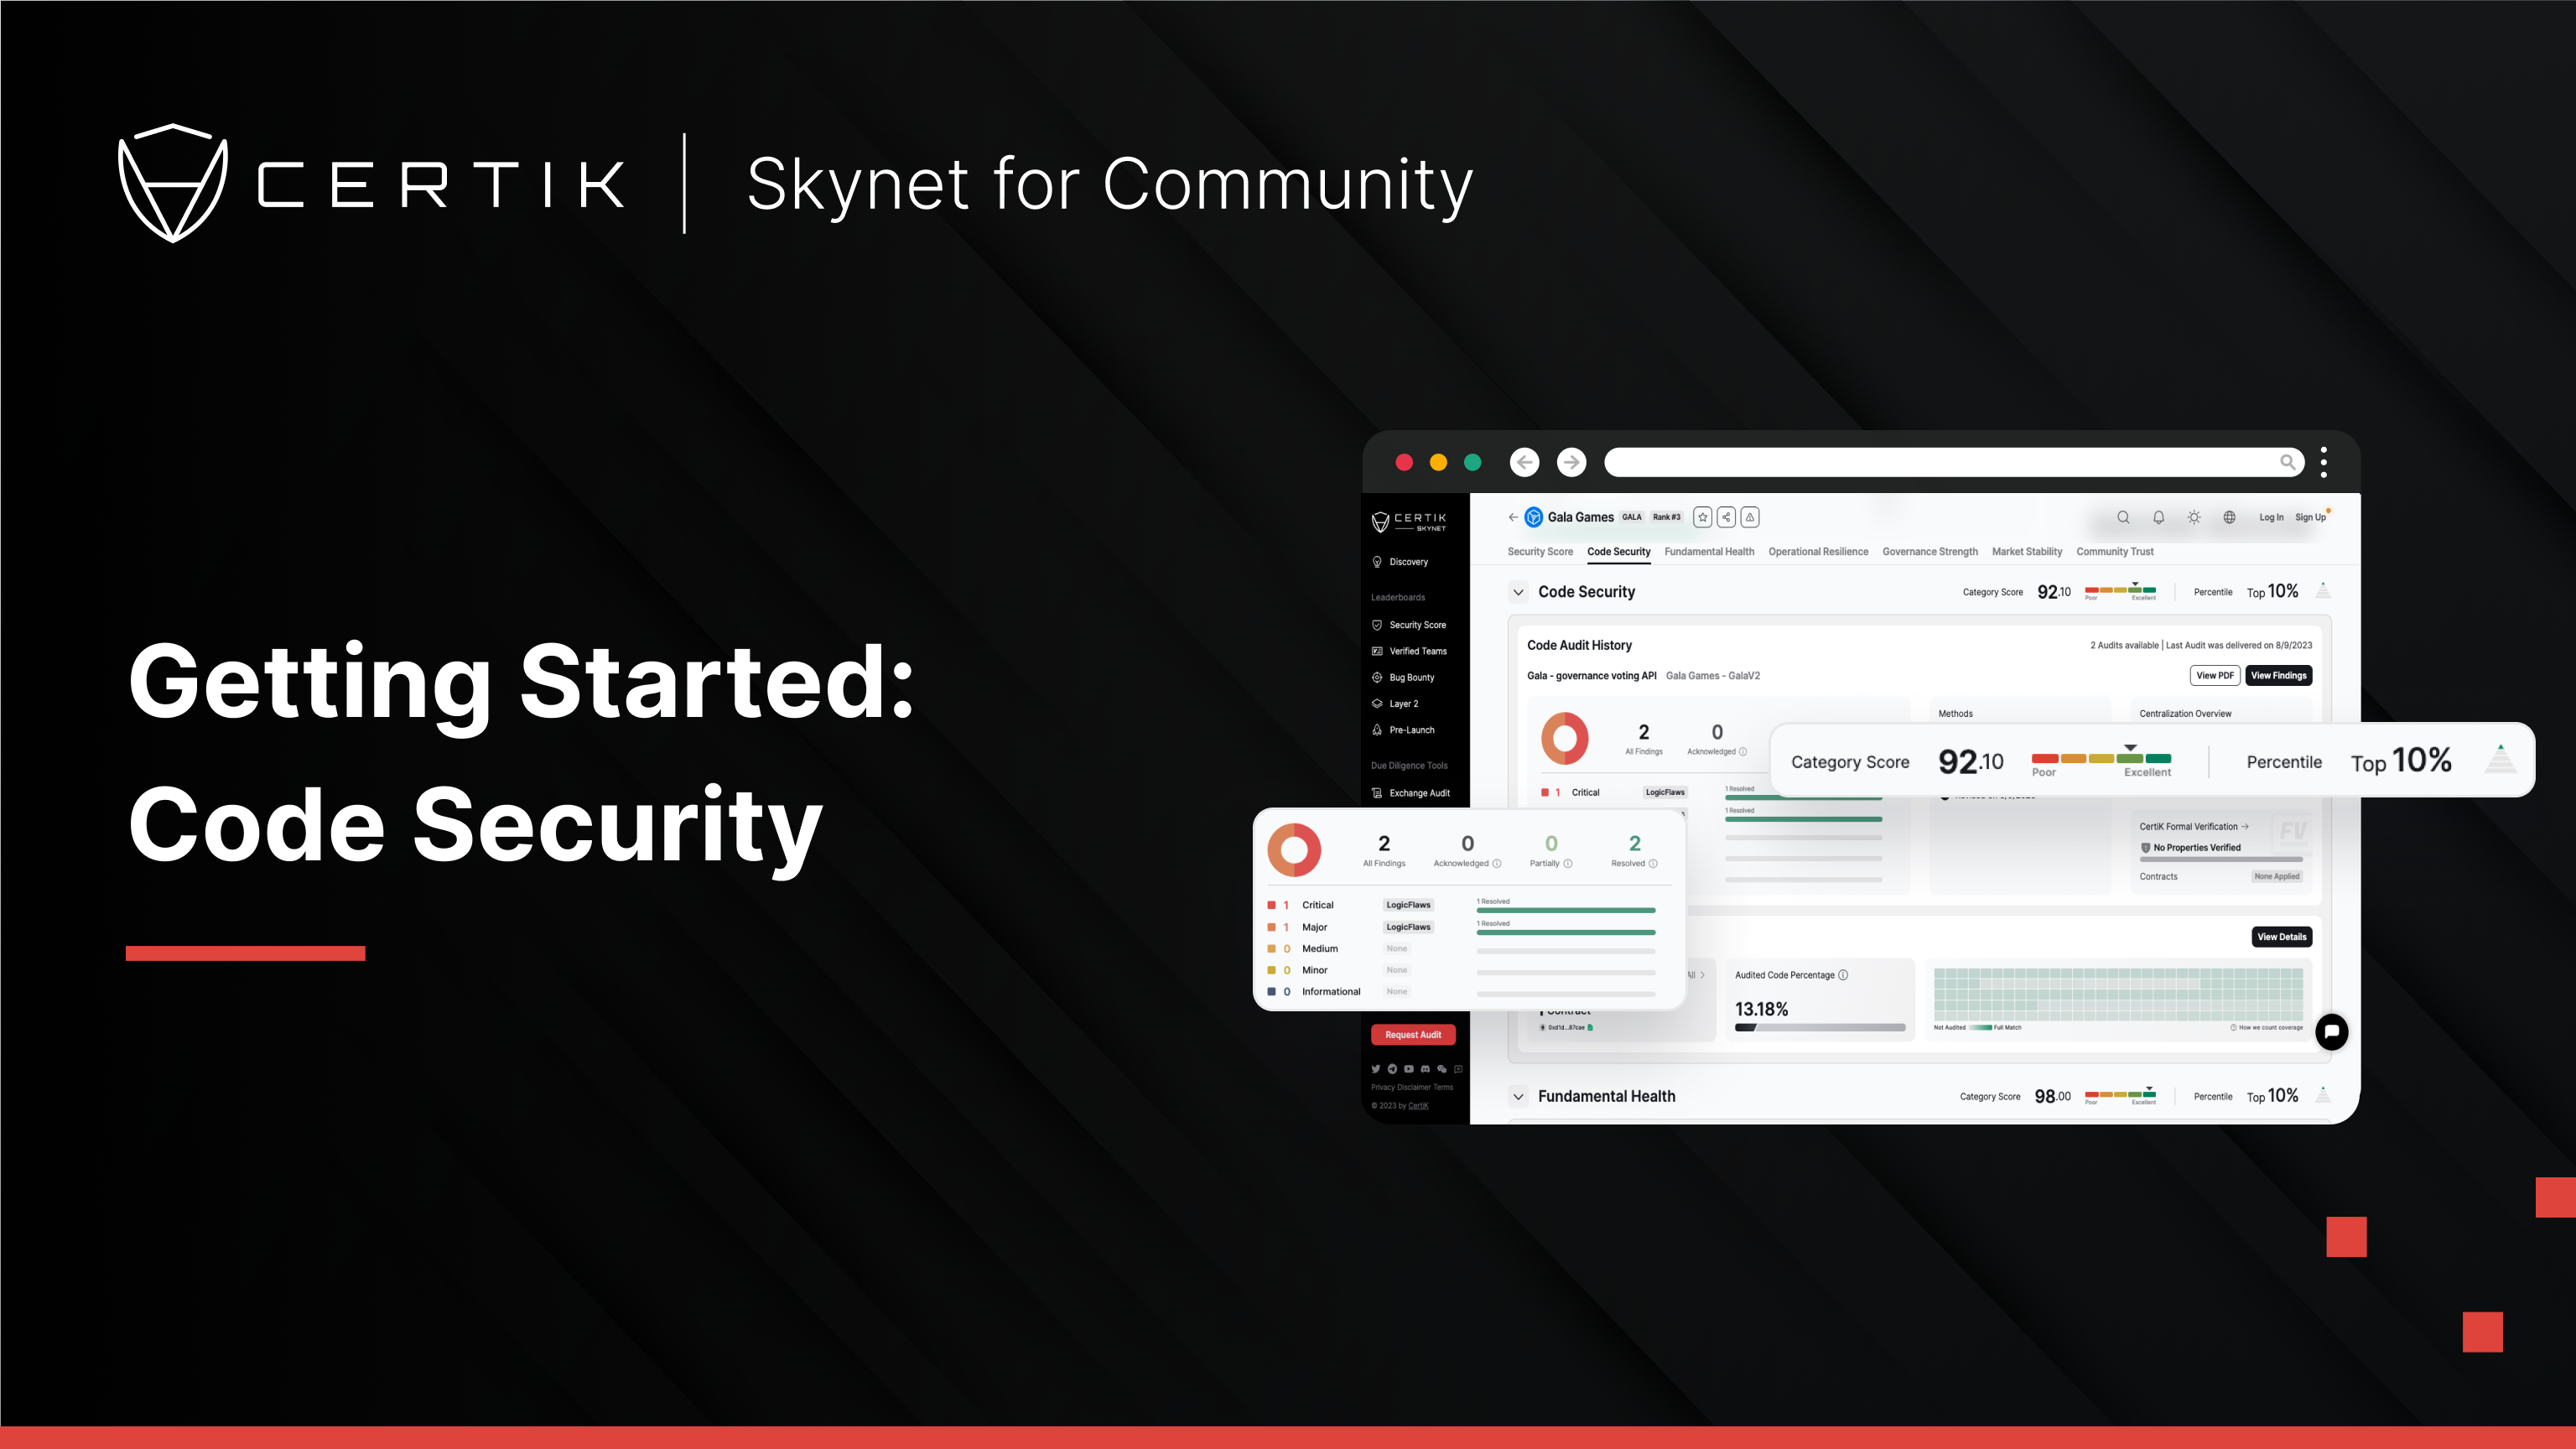
Code Security
The Code Security module contains all the audit reports that are available for a project and provides a detailed overview of the audit findings.